


Reliability Analytics Service
Analyzing equipment failure data to identify recurring issues and reliability improvement opportunities by using statistical methods
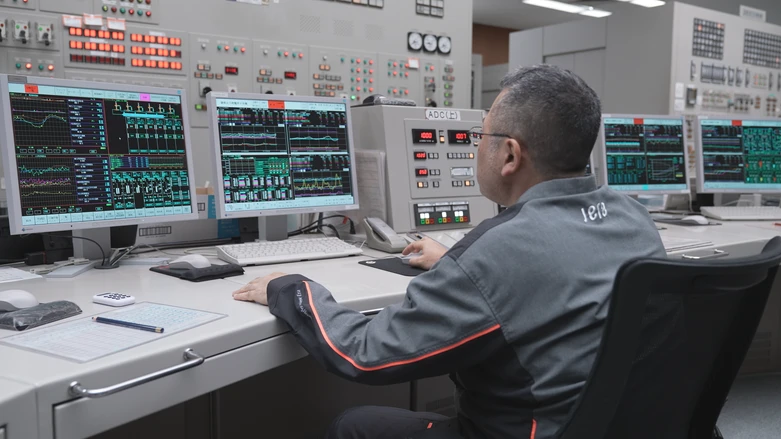
Statistical failure analysis that pinpoints what erodes your availability
JERA's Reliability Analytics Service turns your failure and RCA data into a prioritized, visual breakdown of what really erodes availability — an effective, data-driven approach built on statistical analysis. The result: budget focused on the right equipment and, with optional RCA, the true root cause, for reliability improvement and higher availability.

Issue
-

Too many malfunctions and defects
-

Many forced outages
-

High load manpower
AT A GLANCE
70+ years
Operating thermal power plants worldwide
WHY JERA
Statistics plus a user's perspective
JERA pairs statistical analysis with 70+ years of operating and reliability-engineering experience — the perspective of a user of OEM equipment, not its supplier — to find the real problem and drive availability improvement efficiently.
-
Multi-year
Failure & RCA data analyzed
-
Visualized
Occurrences and MWh loss ranked by equipment
OVERVIEW
What is Reliability Analytics Service
Reliability Analytics Service is a data-driven service that turns your failure history and RCA reports into a clear picture of what erodes plant availability. Through failure analysis, JERA classifies faults by discipline (mechanical, electrical, control), by equipment and part, and by cause (design, operation, maintenance, or workmanship), then ranks them with visualized charts of occurrence count and MWh lost. Rather than fixing everything, it identifies the priority targets and recurring faults — a reliability-engineering and RAM analysis view — so resources go where they most improve availability. Optional RCA support then pins down the true root cause.
BENEFITS
What the analysis delivers
-
01
Clear priorities
Allocate limited people and time by what the data shows, not what we assume.
-
02
Availability improvement
Cut recurring, high-impact failures and forced outages to lift availability.
-
03
Better return on spend
Focus budget on the equipment that actually drives loss, so the same spend buys more availability.
-
04
Identifying true recurring issues
Identify genuinely recurring problems, not just frequently reported ones, and focus effort where it counts.
CASE STUDY
Eight recurring BFP failures traced to the real cause
CHALLENGE
A 25-year-old plant was slipping below its 85% availability benchmark, with limited budget and no clear view of which equipment to prioritize.
SOLUTION
JERA statistically analyzed the plant's failure data, classified faults by discipline, equipment, and cause, and used visual breakdowns of occurrence count and MWh loss. Focusing on high-occurrence equipment isolated boiler feed pump (BFP) bearings — 19.11 hours of forced outage in two years. Optional RCA then found the true cause: an impeller outer-diameter modification three years earlier, made without changing the shaft, overloaded the shaft and raised vibration — not the assembly misalignment the plant had assumed.
RESULT
Revising the shaft specification eliminated the BFP bearing-vibration failures and improved availability.
-
19.11h › 0
Forced outage hours from BFP bearing failures
-
25 years
Plant age; availability slipping below 85%
Source: JERA project record at a power plant in the Philippines (coal-fired). Figures are from one site and will vary by plant configuration and load profile.
Q&A
Reliability Analytics Service, answered
Q. What is Reliability Analytics Service?


It's a data-driven service that turns your failure history and RCA data into a prioritized, visual breakdown of what erodes availability — classified by discipline, equipment, and cause. Instead of fixing everything, it shows where limited budget best raises availability; optional RCA then finds the true root cause.
Q. How many years of failure data are needed?
About five years is the working target. That is enough history to separate recurring faults from one-offs and to make the Pareto ranking and mean-time-between-failures figures meaningful. A shorter record can still be analyzed, but the priority ranking carries more uncertainty.
Q. Do you perform destructive testing of failed parts?
No. The analysis works from your failure records, RCA reports, and plant data, confirmed by an on-site visit. Where physical examination of a failed part is needed to settle a cause, it is arranged separately as part of the optional RCA support rather than within the statistical analysis itself.
EXPLORE MORE
Related O&M Services


Find what's really costing you availability
Request a consultation. Share your failure data and JERA will rank what erodes your availability and where to act first, before you commit.
NOTES
Author: JERA Overseas Engineering Service Group · Reviewed by O&M Engineering Strategy Division Published Sep 2026 · Last updated Sep 2026