Performance highlightsInvestor Relations
We have set management goals related to profitability, capital efficiency, growth, and financial soundness, aiming for specific outcomes by FY2025 (announced in May 2022) and for target levels by FY2035 (announced in May 2024). We are making progress on various initiatives aimed at achieving these management goals.
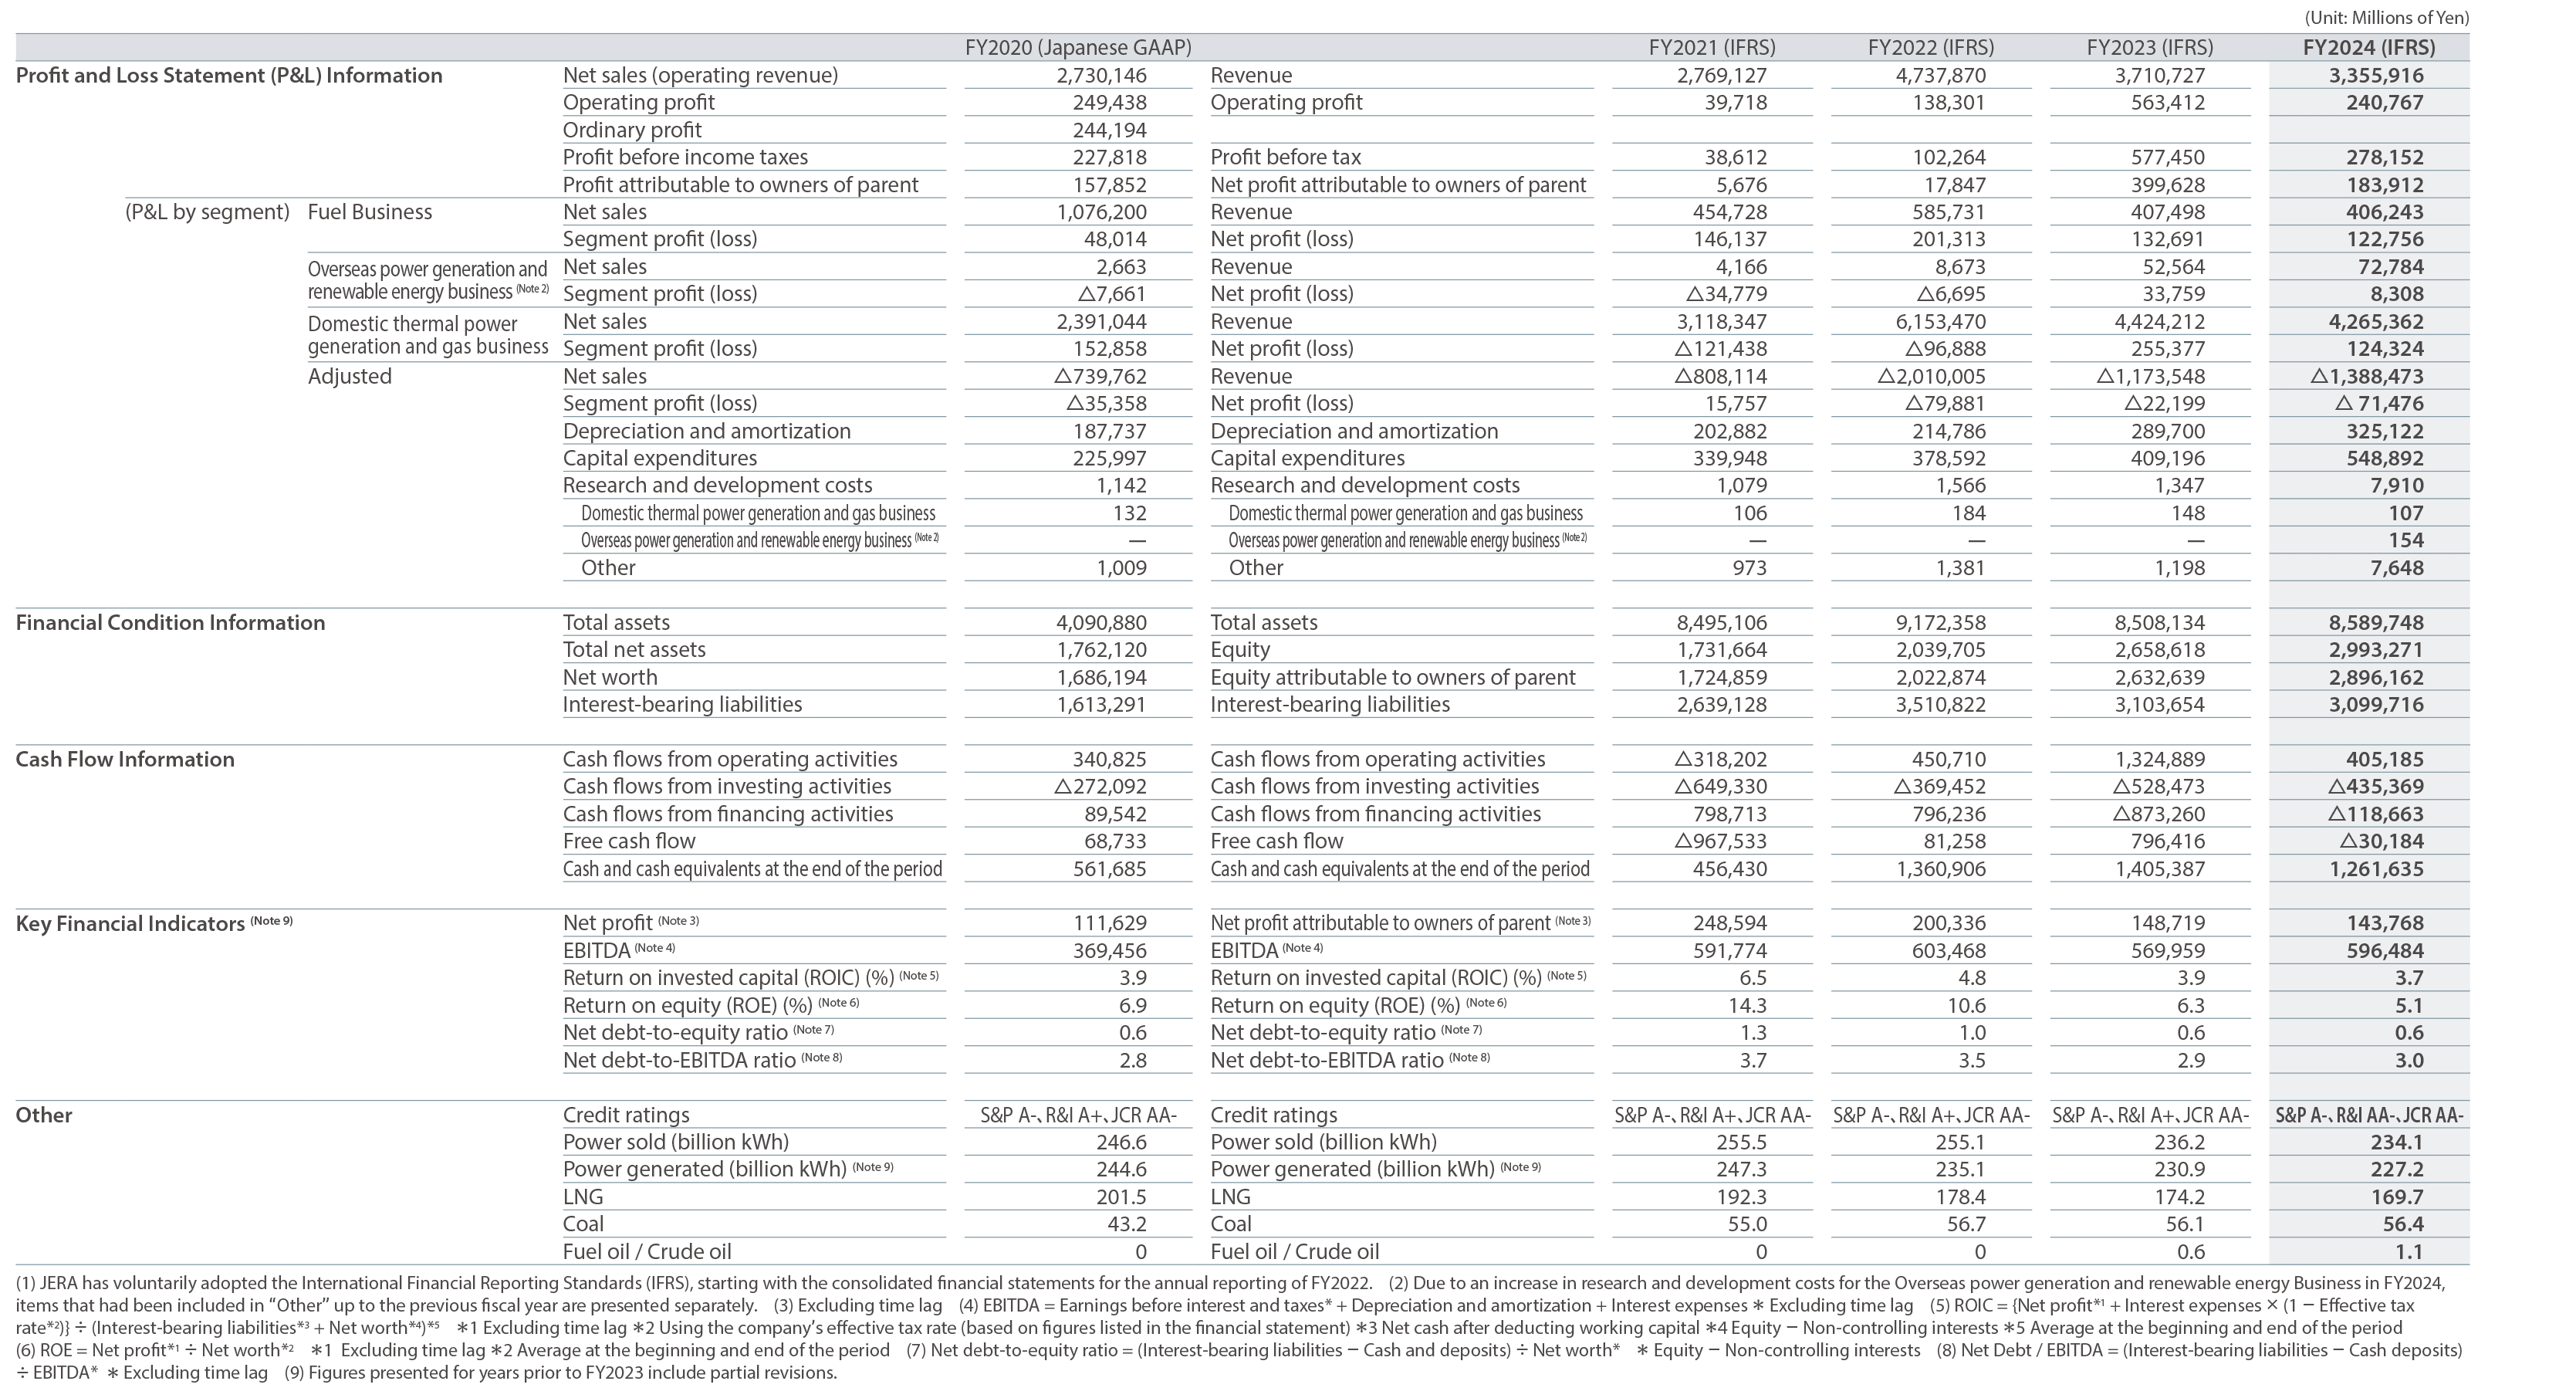
Additionally, with a fundamental emphasis on safety, we are accelerating our sustainability initiatives by empowering diverse talent (D&I) and strengthening corporate governance. We will continue to ensure a stable supply while achieving decarbonization in the medium to long term, aiming for disciplined growth and maximizing corporate value. We have voluntarily adopted the International Financial Reporting Standards (IFRS) starting with the consolidated financial statements for the annual reporting of FY2022, and the figures for FY2021 have also been restated in accordance with the IFRS.
Financial Information
Revenue
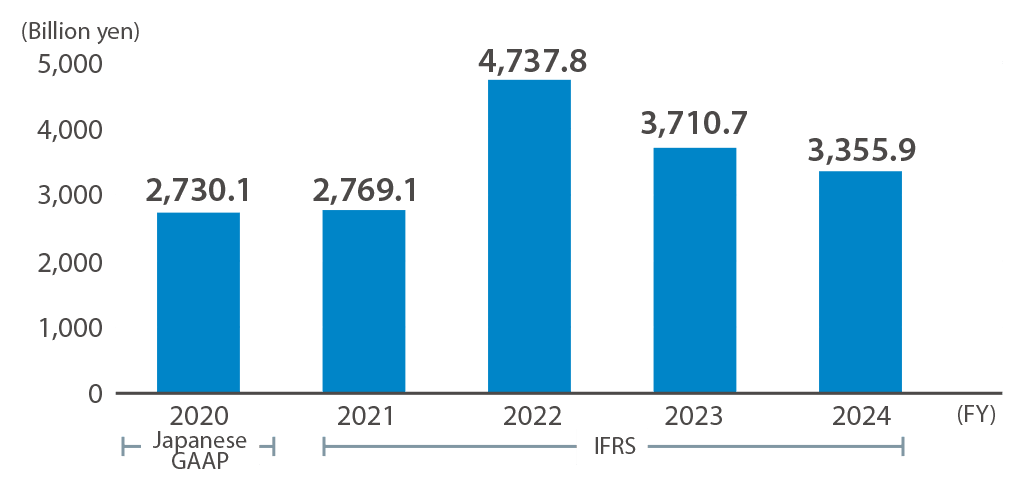
Revenue for FY2024 was 3,355.9 billion yen, down 354.8 billion yen (-9.6%) from the previous year, due to factors such as a decline in unit revenue.
Profit Attributable to Owners of Parent (including/excluding time lag)
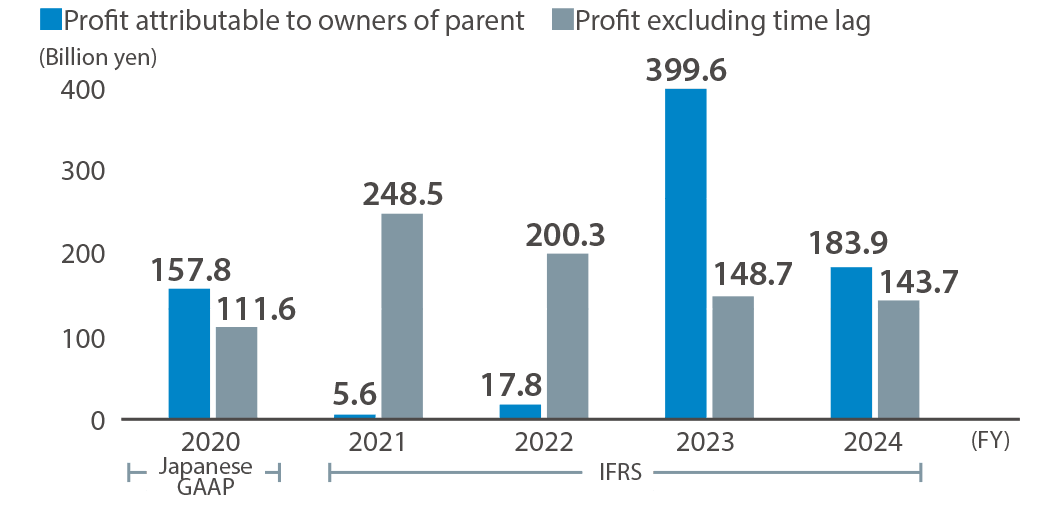
Net profit for FY2024, excluding time lag, decreased despite improvements in the impacts of fuel procurement price and the unit cost of fuel inventory at the beginning of the period. The decrease in net profit was due to factors such as decreased profitability in the overseas power generation and renewable energy business, and in the fuel business.
EBITDA
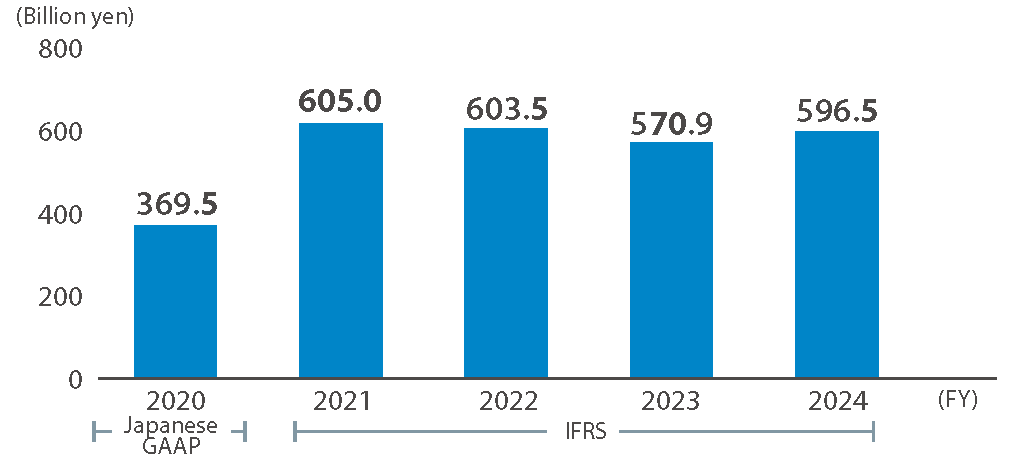
In FY2024, EBITDA remained high due to increased depreciation and amortization, despite a decrease in pre-tax profit compared to the previous year.
EBITDA = Earnings before interest and taxes* + Depreciation and amortization + Interest expenses
- Excluding time lag
ROIC
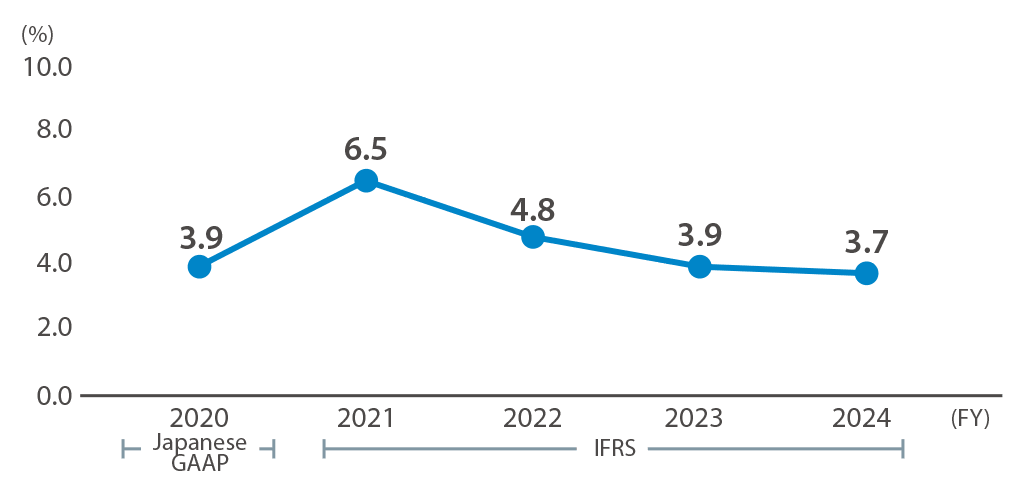
In FY2024, excluding time lag, results declined compared to the previous year, mainly due to a decrease in net income.
ROIC = {Net income*1 + Interest expense × (1 − Effective tax rate*2)} ÷ (Interest-bearing liabilities*3 + Net worth*4)*5
- Excluding time lag
- Using the company's effective tax rate (figures listed in the Financial Statement)
- Net cash after deducting working capital
- Equity — Non-controlling interests
- Average at the beginning and end of the period
Cash Flows from Operating, Investing, and Financing Activities (CF) / Free Cash Flow
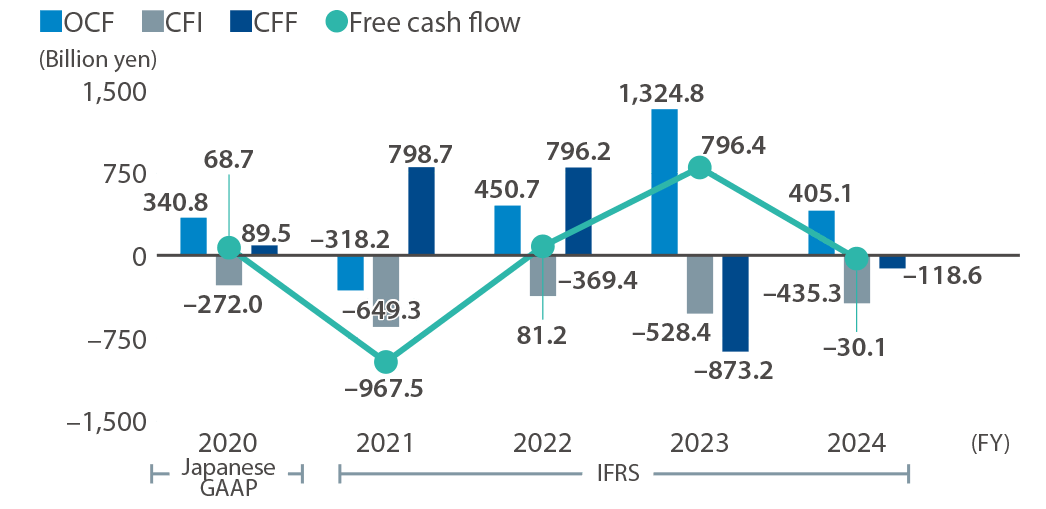
In FY2024, operating cash flow decreased by 919.7 billion yen from the previous year to 405.1 billion yen, driven by factors such as a decrease in pre-tax profit and an increase in accounts receivables and inventories.
Cash flow from investing activities decreased by 93.1 billion yen compared to the previous year, amounting to 435.3 billion yen, due to a reaction from last year's expenditures on acquiring affiliated companies. As a result, free cash flow decreased by 826.6 billion yen, leading to an expenditure of 30.1 billion yen.
Interest-Bearing Liabilities / Net Debt-to-Equity Ratio
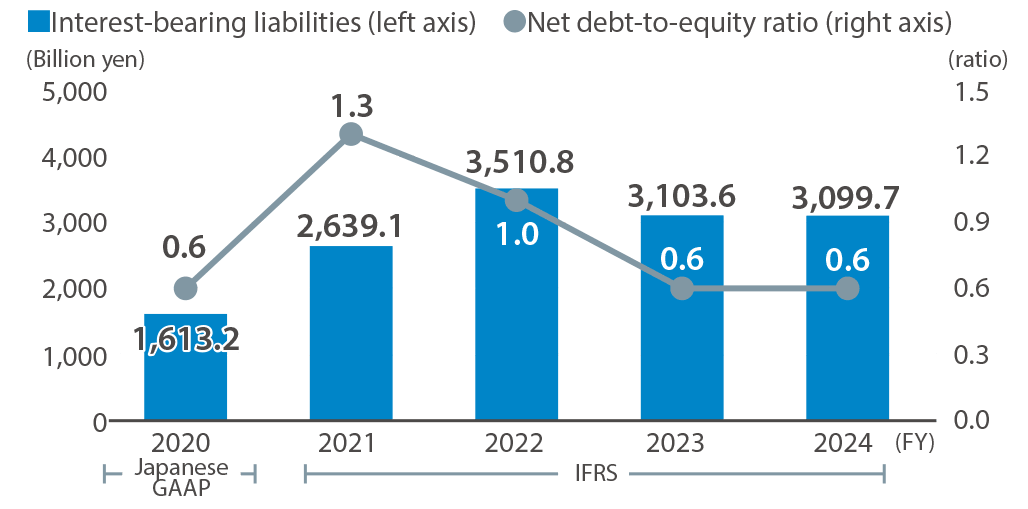
The balance of interest-bearing liabilities in FY2024 was 3,099.7 billion yen, the same as the previous year. As a result, the net debt-to-equity ratio was 0.6 times, the same as the previous year. Net debt-to-equity ratio = (Interest-bearing liabilities - Cash and deposits) ÷ Equity*
Net debt-to-equity ratio = (Interest-bearing liabilities − Cash and deposits) ÷ Net worth*
- Equity — Non-controlling interests
Pre-Financial
FY2024 Domestic Power Generation Output (by fuel type)
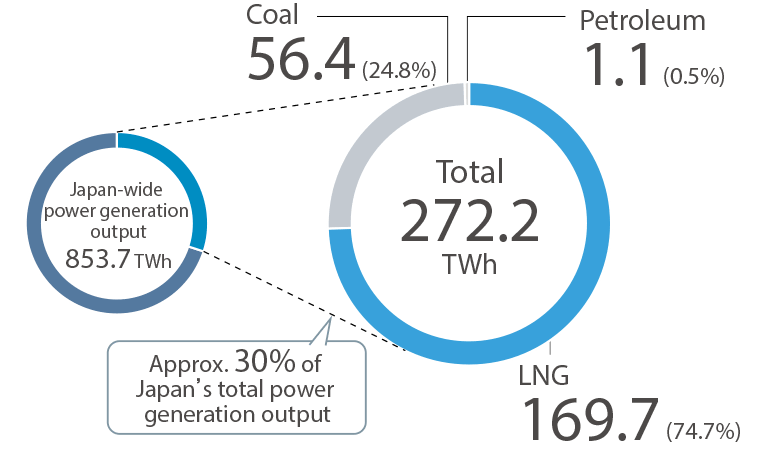
We are responsible for approximately 30% of the power generation output by domestic electric utilities. A large portion of this power generation comes from LNG, which has low CO2 emissions.
- Source: Agency for Natural Resources and Energy website as published on June 14, 2024 [Japanese Only]
FY2024 CO2 Emissions (Scope 1) / Domestic CO2 Emissions Intensity*
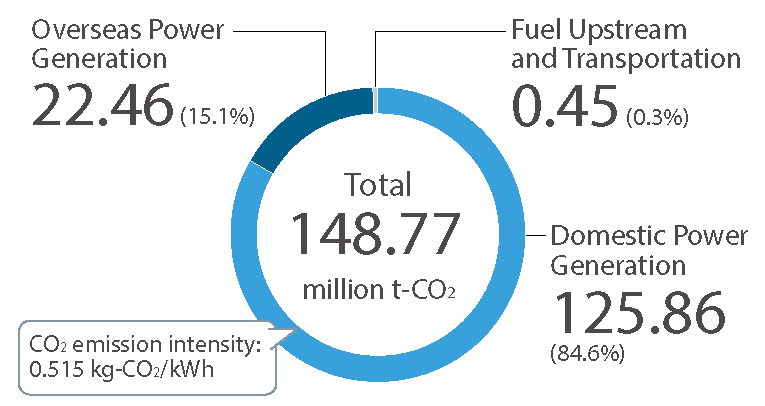
As part of JERA Environmental Target 2035, we aim to reduce domestic CO2 emissions relative to FY2013 by 60% by FY2035.
Renewable Energy Output Share
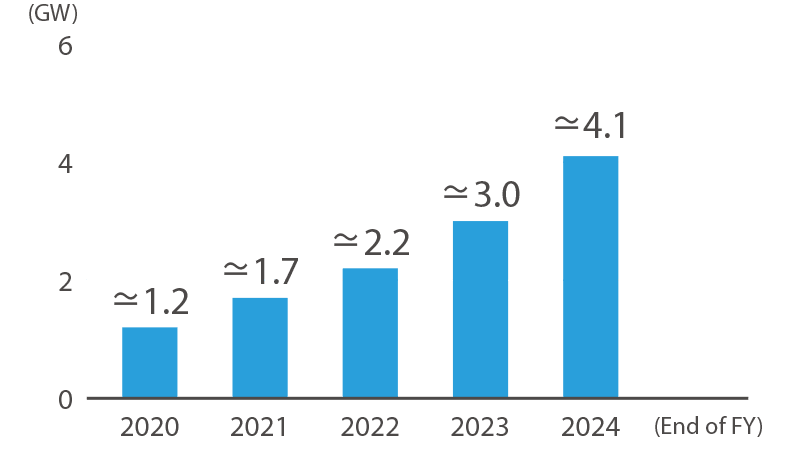
Our center of excellence in Europe and local teams will work closely together to develop wind and solar power projects on a global scale.
Employee Injury Frequency Rate
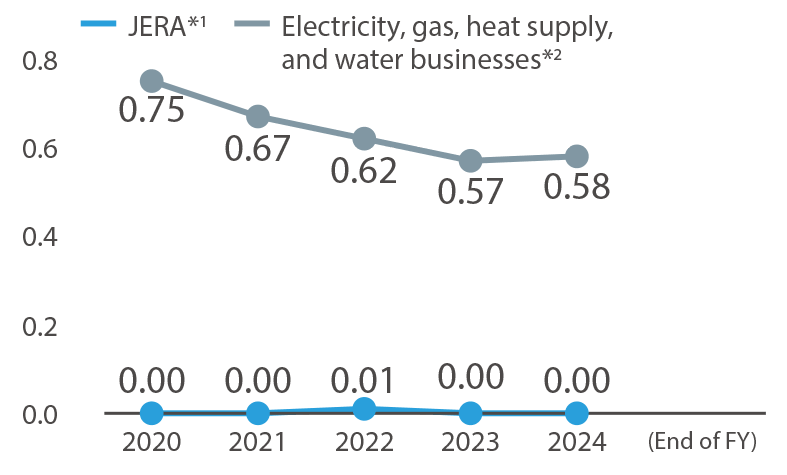
We are committed to company-wide efforts for safety, the bedrock of our business, with aims to eradicate occupational accidents.
- JERA employees only
- Figures based on calendar year (January to December)
Note: Excludes commuting accidents
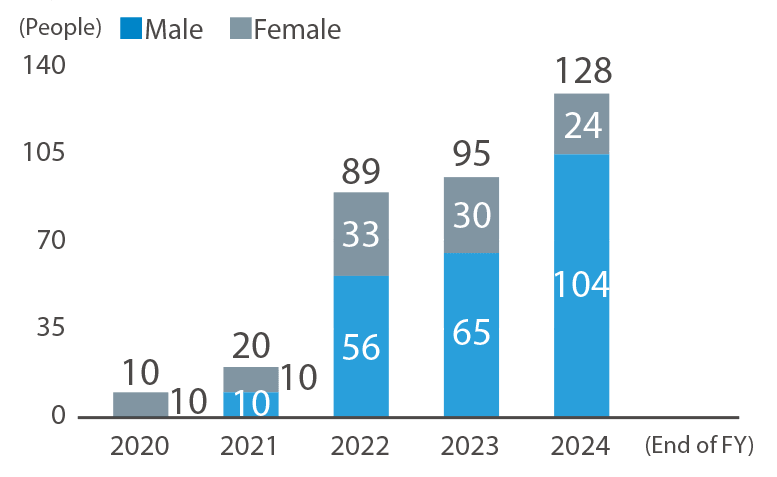
Number of Mid-Career Hires (by gender)
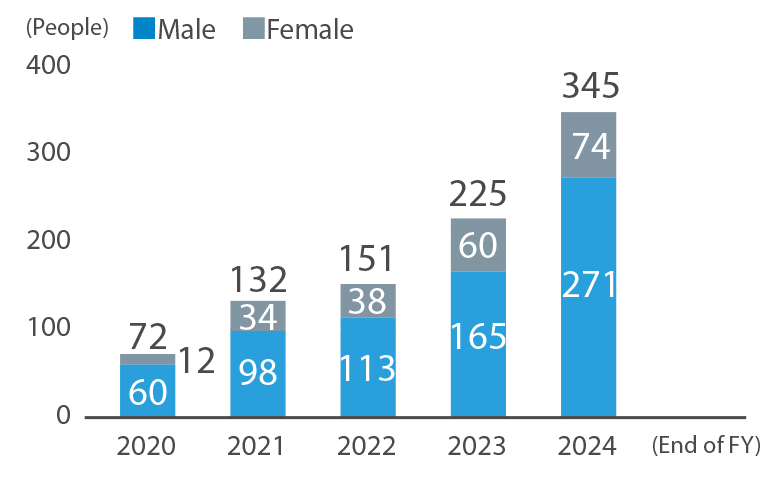
We are actively hiring people with diverse backgrounds and advanced expertise not yet represented at JERA. With the demand for agile matching of talent to business strategy, the number of mid-career hires is showing an annual upward trend with the growth of each business.
Number of Employees Taking Childcare Leave (by gender)*
To support employees in balancing work and family life, we promote the use of our childcare leave system. In recent years, uptake among male employees has grown, reflecting broader efforts to accommodate diverse lifestyles.
- JERA only
Number of Outside Directors
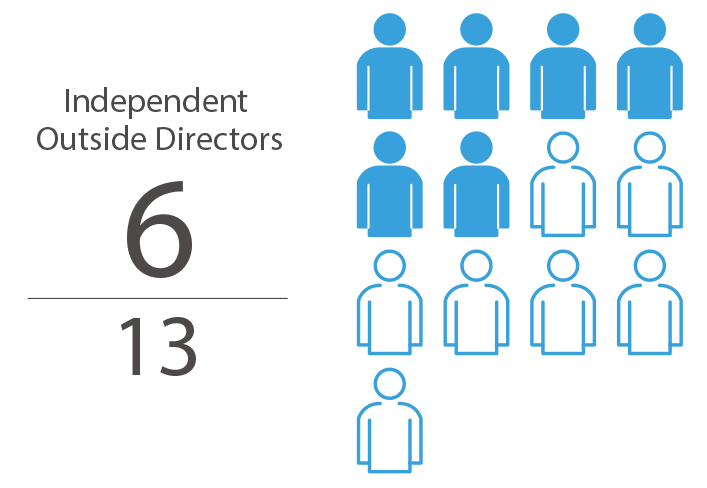
In addition to JERA-employed executive directors and directors who have come from our shareholder companies, we hire outside directors in order to create an autonomous and independent corporate culture and a management structure that enables fair and prompt decision-making.
- As of July 1, 2025
Diversity on the Board of Directors
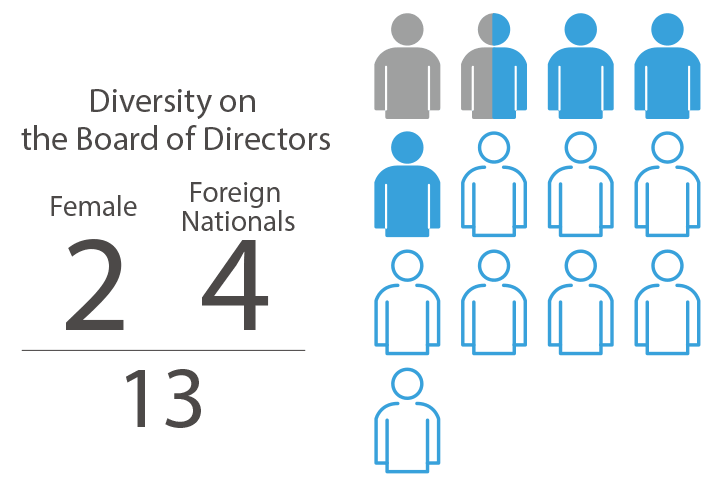
We believe that a diverse Board of Directors leads to better business decision-making and have made efforts to appoint female and foreign nationals to the Board.
- As of July 1, 2025
Financial Data