


Cost Benchmarking Service
Identifying cost optimization opportunities through O&M benchmarking
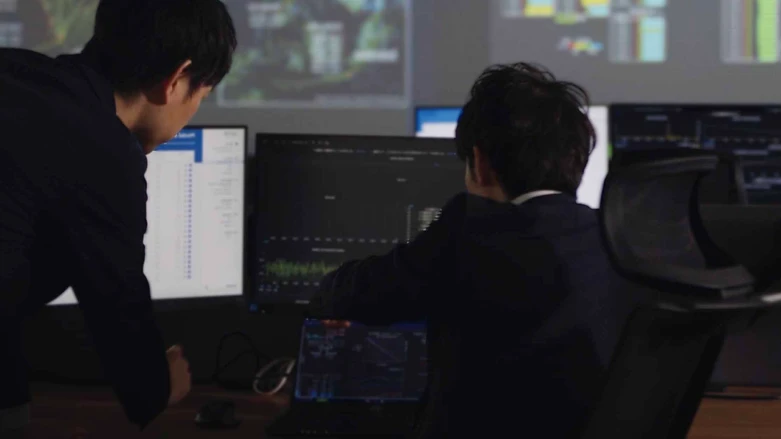
Reducing O&M cost through data-driven benchmarking — without compromising reliability
JERA's Cost Benchmarking Service benchmarks your O&M cost ($/kW, CAPEX and OPEX) against JERA's operating fleet database to pinpoint high-cost systems — reducing O&M cost through targeted CAPEX and OPEX optimization. The result: lower total cost of ownership, a better levelized cost of electricity, and longer equipment life — with reliability intact.

Issue
-

Rising O&M costs without clear drivers
-

Lack of benchmarks against global standards
-

Unclear balance between PM and CM
AT A GLANCE
70+ years
Operating thermal power plants worldwide
WHY JERA
A benchmark built from real operation
Not a consultant's spreadsheet — JERA benchmarks your cost against its own fleet, using a database from 70+ years of running power plants.
-
$/kW
Normalized metric
— comparable across plant sizes
-
~30
Overseas IPPs for close-market comparison
(as of 2026)
-
3
Units benchmarked overseas
(as of 2026)
OVERVIEW
What is Cost Benchmarking Service
Cost Benchmarking Service clarifies the O&M cost structure of your power plant and compares it — in $/kW — against JERA's operating fleet database. By separating CAPEX and OPEX, PM (preventive maintenance) and CM (corrective maintenance) work, and cost by equipment, it visualizes which systems drive high O&M expense. JERA then pinpoints where CAPEX and OPEX optimization applies and proposes concrete improvements — reducing O&M cost through targeted optimization, without compromising equipment soundness.
BENEFITS
What benchmarking delivers
-
01
Cost drivers made visible
Cost is broken down by equipment, work type and PM/CM, so the systems driving your spend are identified.
-
02
Where your cost stands in the data
Your O&M cost is compared in $/kW against JERA's operating fleet database, on a like-for-like basis.
-
03
The right PM/CM balance
Preventive work is focused on critical equipment, while less critical items are managed on a run-to-repair basis — cutting cost without compromising equipment soundness.
-
04
Lower cost, longer life
Lower total cost of ownership, longer equipment life and fewer unplanned outages.
CASE STUDY
Pulverizer OPEX brought back toward benchmark
CHALLENGE
A coal-fired plant's maintenance cost ran ~15 $/kW above JERA's; boiler OPEX was more than double, driven by high pulverizer repair.
SOLUTION
Reviewing work and purchase orders showed frequent pulverized-coal-pipe leak repairs. JERA revised the inspection manual and interval, shared its HOZEN maintenance cycle, and proposed switching roller/table material from carbon steel to ceramic to extend life.
RESULT
A concrete plan to lower pulverizer cost and extend equipment life — with the HOZEN cycle reusable across other equipment.
-
+15 $/kW
Total cost above JERA fleet
-
2×
Boiler OPEX vs JERA
Source: A JERA project at a power plant (coal-fired) in Southeast Asia. Figures are from one site and will vary by plant configuration and load profile.
Q&A
Cost Benchmarking Service, answered
Q. What is Cost Benchmarking Service?


It compares your O&M cost ($/kW, CAPEX and OPEX) against JERA's operating fleet database to pinpoint the systems driving high O&M expense. JERA then proposes concrete ways to optimize cost and extend equipment life — with reliability intact.
Q. What makes JERA different from a consultant?
Engineering firms and business consultants don't grasp real power-plant O&M cost from hands-on experience — JERA does. Drawing on an extensive database from operating many plants, JERA proposes optimal cost allocation and delivers savings through O&M optimization.
Q. Plants differ in equipment and operation — is this really apples-to-apples?
JERA operates many CCGT and conventional thermal plants across gas, coal, and oil, so it can compare you against plants close to yours. Rather than using your raw cost data as-is, JERA organizes and adjusts for differences in equipment configuration and operating conditions to provide as close to an apples-to-apples comparison as possible.
Q. Can our plant be compared with plants in other countries?
Yes. With around 30 IPPs overseas, JERA benchmarks using O&M cost data from IPPs in markets close to your business environment.
Q. How is customer support handled?
Please contact the Account Manager in our Overseas Technical Service Department. They confirm details with the relevant in-house specialists and respond to you directly.
EXPLORE MORE
Related O&M Services

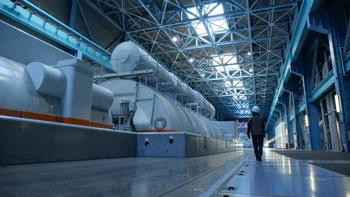
Benchmark your plant against JERA's operating fleet database
Request a consultation. JERA will visualize your O&M cost structure, show where you stand against its fleet, and identify where cost can be optimized — before you commit.
NOTES
Author: JERA Overseas Engineering Service Group · Reviewed by O&M Engineering Strategy Division Published Sep 2026 · Last updated Sep 2026